

01 - INTRODUCTION
The End of Capital-Light
For fifteen years, investors paid a premium for capital-light business models, businesses that scaled on code and near-zero marginal cost. Anyone who poured concrete, strung wire or pulled resources out of the ground got a very different message: cut capex and hand the cash back to shareholders.
In our view, that era is ending. AI, electrification, reshoring, defence, energy security and a decade and a half of deferred spending are all pushing capital back into the physical economy at once and, importantly, into a system with very little spare capacity. We believe the result is a multi-year build-out the market may still be underestimating.
But big spending isn't the same as good returns. A build this size creates backlogs and pricing power. It also inflates costs and, historically, leaves many investors holding assets that never earned their cost of capital. The question today is who will capture the economics of this capital supercycle and what will separate the winners and losers.
02 - HOW WE GOT HERE
The Cost of Underinvestment
North America has spent roughly the last 15 years underinvesting in physical capacity. For most of that time, investors had it easy. Globalization kept costs low, central banks suppressed interest rates and capital flowed freely across borders. The biggest winners were asset-light businesses that could grow enormously without consuming much labour, energy, commodities or infrastructure.
In hindsight this sounds reckless, but at the time it was a rational response to flat demand, cheap money and markets that rewarded capital lightness. But the bill has come due, all at once, to an industrial base sized for a world that no longer exists.
Where the Gaps Are
The underinvestment wasn't evenly spread. It has become clearly apparently in the same four areas now at the centre of the build:
- The power grid. Transmission and distribution were maintained, not expanded.
- Generation. Little new firm capacity was added while demand flatlined, leaving less margin for error once load returned.
- Energy production and pipelines. After the 2014 oil crash, producers traded growth for shareholder returns, and major pipeline projects stalled or were cancelled.
- The industrial base. Offshoring left North America short of domestic capacity in everything from transformers to semiconductors.
Taking the grid as an example, for years electricity demand barely grew, so utilities had little reason to add capacity. They focused on maintenance rather than expansion. The same pattern played out across the other gaps. Energy producers returned cash instead of building, pipelines stalled, and manufacturers expanded overseas rather than at home. Each decision made sense on its own. Together, they left the system with almost no slack, which raises the question as to why an entire economy chose to stand still.
Part of the answer lies in the capital markets. In a zero-rate world, the highest multiples went to businesses with high ROIC, minimal reinvestment and recurring revenue. Heavy industry and energy were pushed toward returning capital through buybacks and dividends instead of building new capacity. Across markets, the cost of capital for long-lived physical assets rose in relative terms, even as absolute rates fell.
A Hollowed-Out Supply Chain
Layer flat demand and capital discipline on top of decades of offshoring, and the industrial supply chain hollowed out. Fewer manufacturers of transformers and other heavy electrical equipment remained, and those that did had no reason to expand. Then demand turned, and there was no spare capacity to absorb it. Today, large gas turbines are now largely sold out through 2030.1 We believe, supplier scarcity today has become a direct product of supplier rationalization in the past.
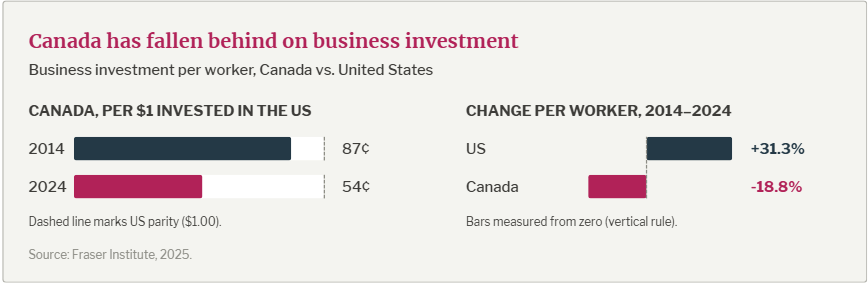
To make things worse, North America's regulatory backdrop added friction. Transmission, pipelines and large generation projects have faced long, uncertain approval processes. Where projects could avoid multi-jurisdictional approvals, they got built. Elsewhere, they mostly didn't. In Canada, the problem was even more pronounced. In 2014, Canada invested about 87 cents per worker for every dollar invested in the United States; by 2024, that had fallen to 54 cents. Over the same decade, Canadian business investment per worker fell 18.8% while US investment per worker rose 31.3%.2
Add the 2014 oil price collapse and the cancellation of Northern Gateway, Energy East and Keystone XL, and a perception took hold that large Canadian infrastructure couldn't get built. That's why Alberta's current data centre and gas-to-power push matters: it's a test of whether that perception is finally changing.
The Bill Comes Due
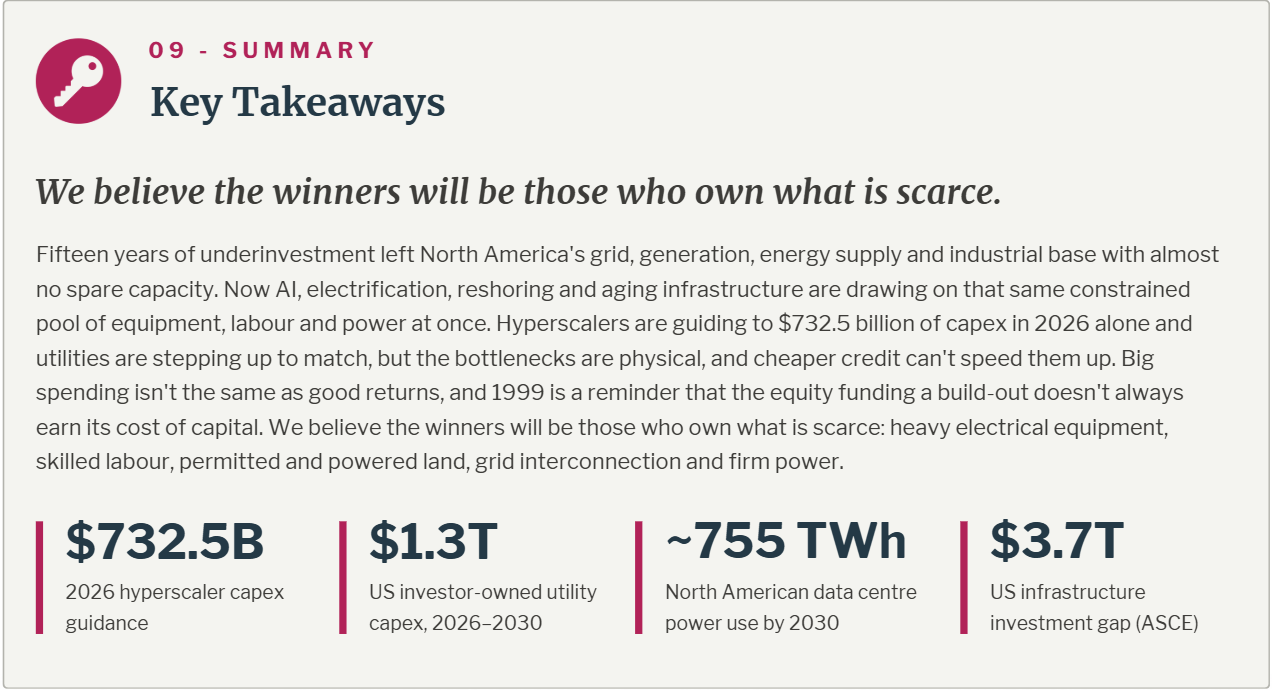
To put some numbers behind this trend, ASCE's 2025 Report Card graded US energy infrastructure a D+, down from C– in 2021, and projects a $3.7 trillion gap between planned and needed infrastructure investment, up from $2.59 trillion four years earlier.3

Underinvestment flattered returns for 15 years. Low reinvestment boosted free cash flow, buybacks and margins across utilities, energy and industrials, while capital-light sectors captured the valuation premium.
But today we are starting to see a reversal. Capital intensity is rising across the economy, scarce physical capacity continues to push upward, and returns are likely shifting toward whoever owns the bottlenecks. Not to mention, this cycle carries an inflationary element the latter didn't. Rebuilding physical capacity competes for labour, materials and equipment in a way software never did, one reason the capital-light era's mix of low rates and high multiples may not return quickly.
03 - THE DEMAND SHOCK
AI is Becoming a Resource Story
Investors still tend to view AI as a software story. It is rapidly becoming a resource story. What separates this cycle from the digitalization that came before is its collision with physical reality: the binding constraint has shifted from code to power.
The infrastructure behind AI demands staggering amounts of electricity, copper, steel, cement, natural gas and critical minerals. Data centres are becoming some of the largest power consumers anywhere, forcing utilities to rethink grids built for a very different world. And financing it all means a massive amount of capital required.
The Hyperscaler Spending Surge
If AI is the demand shock, the hyperscalers are the most obvious starting point. Microsoft, Meta, Amazon and Alphabet (the largest cloud and AI platforms) are anchor customers for this build. Their data centre orders set demand for chips, power, electrical equipment and construction all the way down the supply chain. In addition, their business models personify the shift we have been describing. For most of the last fifteen years, these companies have been the capital-light market winners. Today, they're writing some of the largest capex cheques in corporate history.

Their combined capex reached $301 billion in the first half of 2026 alone, with updated guidance pointing to $732.5 billion for the full year, 39% above analyst expectations from November 2025 and 158% above expectations from September 2024.4
As a result of this spending the financial profiles of these companies is changing significantly. Capex now runs at roughly half of revenue for several hyperscalers,5 which is even higher than the mid-teens to 20s typical of mature telecoms and utilities. In addition, analyst estimates are calling for FY26 free cash flow could approach zero or turn negative for all but Alphabet and Microsoft.6 In order to fund this amount of spending, Meta, Alphabet and Amazon have each raised tens of billions in bonds since late 2025 and that isn’t expected to stop.
Downstream: Utilities and Power
Importantly, this build doesn't stop at the data centre. It has downstream effects on utilities, power generators, equipment makers and commodity producers alike. S&P Global expects US investor-owned utility capex near $1.3 trillion over 2026–2030, with the electric utility group's spending rising from about $81 billion in 2025 to $108 billion in 2026 and $112 billion by 2028.7 The appetite for spending is there but now investors are faced with the question as to whether the physical system can absorb that much spending and build what it's paying for.
04 - CONSTRAINTS
The Bottlenecks are Physical
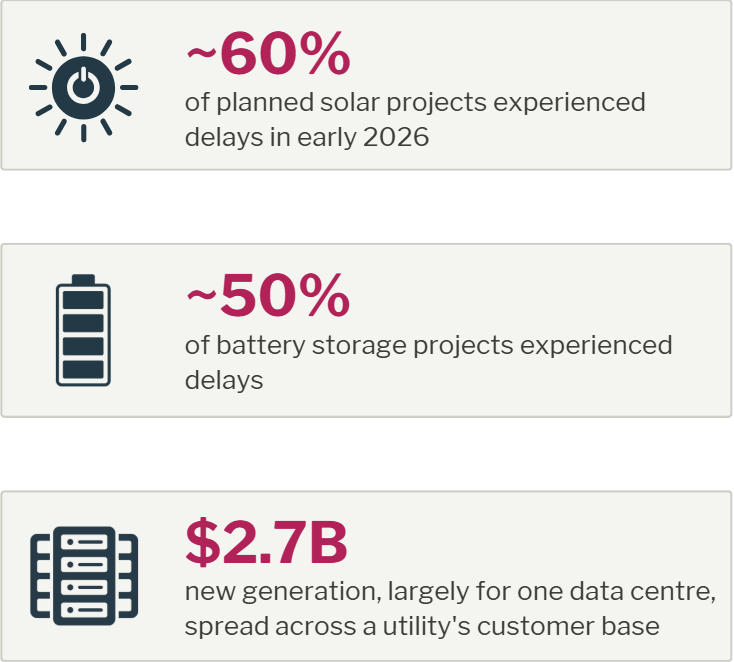
Right now, it can't, at least not at the pace being planned. The first constraint is equipment: as noted earlier, large gas turbines are sold out for years, and transformers face similar backlogs. The second is execution. In early 2026, approximately 60% of planned solar projects and 50% of battery storage projects experienced delays.8
Then there's the question of who pays. In West Virginia, a FirstEnergy subsidiary plans to spread the cost of $2.7 billion in new generation, built largely for one data centre customer across its broader customer base. But, asking ratepayers to suddenly fund expensive capital build-outs is a hard sell, and we believe affordability, maybe even more than demand, is becoming the binding constraint.
05 - CONVERGING DEMAND
Four forces converging on the same physical system
If AI were the only source of demand, those constraints would be manageable, and perhaps the system would simply build a little slower. But AI isn't standing alone. Four forces are converging on the same physical system at once, and all four are drawing on the same constrained pool of equipment, labour and power.
- AI and data centres
Unprecedented compute investment, at unprecedented power density. Single AI racks now draw over 100 kW, versus 5–10 kW in a traditional data centre. North American data centre electricity consumption is projected to nearly double, from over 386 TWh in 2025 to about 755 TWh by 2030.9
- Electrification
Growing load from transportation, industry, buildings and digital infrastructure makes the grid the single largest capital requirement in the build. Global transmission and distribution networks may need $15.8 trillion of cumulative investment between 2025 and 2050.10 In the US, peak demand is forecast to rise 18% over the next decade.
- Reshoring, energy security and reindustrialization
The push for resilient domestic supply chains is redrawing the production map. US manufacturing construction spending roughly tripled from $82 billion in 2021 to $244 billion in 2024.11 About $1.42 trillion of new US manufacturing investment was announced between January 2025 and mid-March 2026, concentrated in semiconductors, pharmaceuticals and clean energy.
Every new plant also needs reliable power, which is why generation, fuel supply, pipelines and domestic production are back on the policy agenda. In Canada, it's already showing up in Alberta. Pembina's $4.6 billion, 932 MW Greenlight Electricity Centre is intended to serve a data centre, turning price-challenged gas into contracted, long-duration power revenue.
- Aging infrastructure and deferred investment
Replacement and modernization that can no longer be postponed. Much of North America's energy system is nearing the end of its service life, and the investment gap is widening, not closing. Any one of these would support a healthy capex cycle. Together, they compete for the same transformers, electricians, turbines and interconnection queues.
06 - CYCLE DYNAMICS
More Than a Normal Construction Cycle
A normal construction cycle is rate-sensitive, spread across many small buyers, and mean-reverts within a few years as supply catches up. We believe, this build is different, it represents a transition of the digital economy toward an industrial model, where physical assets are the competitive moat. Four features set this cycle apart:
- The buyers are rewriting their business models
In a typical cycle, developers, homebuilders or industrial firms add capacity at the margin and pull back when conditions change. Here the demand comes from the world's largest companies, and they aren't adding capacity to an existing model. They're changing what kind of company they are. When a handful of megacaps move from asset-light to capex approaching half of revenue, it resets how that part of the market is valued.
- It breaks a multi-decade demand trend
Construction cycles usually oscillate around a stable trend. Electricity demand growing at 4% a year after 15 flat years isn't an oscillation, it's a new trend line. A shift that size forces utilities to rebuild their long-range planning from scratch, and their capex step-up shows they already are.
- Every layer is being built at once
A housing or office boom mostly stresses one supply chain. This build needs chips, data centres, generation, transmission, gas supply, cooling and skilled labour simultaneously, and each layer can constrains the others. With turbines scarce, developers are turning to on-site gas engines while utilities extend coal plants and pursue batteries and transmission upgrades. When the bottleneck is physical rather than financial, cheaper credit alone may not speed things up. That keeps pricing power with suppliers for longer than a normal cycle would.
- The motive is strategic, not rate-driven
Normal cycles turn when rates rise or margins compress. This one is propelled by a competitive race among hyperscalers, plus national-security and industrial-policy goals like reshoring and energy security. Hyperscalers have kept raising guidance even as free cash flow approaches zero and they turn to bond markets. Spending that continues while cash generation deteriorates is the opposite of normal cyclical behaviour, where falling cash flow triggers cuts.
07 - HISTORICAL LENS
Is this another 1999?
It's the question on many investors' minds, and the answer is more complicated than yes or no. Our short answer: partly.
Where it differs. The late-1990s fibre build was funded largely by leveraged, often unprofitable carriers. Today's biggest spenders are among the most profitable companies in history. And much of the physical layer is backed by replacement need that exists with or without AI.
Where it is alike. The spenders' cash cushion is thinning. Free cash flow is expected to approach zero or turn negative this year for some of the large hyperscalers, and funding has shifted to bond markets and off-balance-sheet vehicles. Servers with five-to-six-year lives financed with long-dated debt is a duration mismatch the telecom era would recognize. And depreciation hasn't caught up to the spend yet.
The fibre of 1999 got built, lit and eventually used. The equity that funded it mostly didn't earn its return. The lesson isn't to avoid the build, it's to be deliberate about which part of it you own.
08 - CONCLUSION
Follow the Bottlenecks
When everything needs building at once, we believe value accrues to whatever is scarce. Today that's heavy electrical equipment, skilled labour and specialty contractors, permitted and powered land, grid interconnection and firm power.
The capital-light era rewarded owning nothing. The next one may reward owning the thing everyone else is waiting for.
To find out who your local Pender contact is, please visit https://penderfund.com/contact-us/
This white paper contains certain forward-looking statements within the meaning of applicable securities laws. Forward-looking statements are frequently characterized by words such as "expect", "believe", "anticipate", "may", "could", "would", "should", "will", "estimate", "project" and similar expressions. These statements are based on current opinions, expectations and assumptions as of the date they are made and are subject to a variety of risks, uncertainties and other factors that could cause actual events, results or outcomes to differ materially from those expressed or implied in the forward-looking statements. Readers should not place undue reliance on forward-looking statements. The views expressed are subject to change without notice and no obligation is undertaken to update or revise any forward-looking statements, whether as a result of new information, future events or otherwise.
References
[1] Vistergy, "Gas Turbines Are Sold Out to 2030," Vistergy, accessed November 18, 2026, https://vistergy.com/p/gas-turbines-are-sold-out-to-2030.
[2] Tegan Hill, Joel Emes, and Taylor Oliver, Comparing Business Investment per Worker in Canada and the United States, 2007–2024 (Fraser Institute, July 16, 2026), https://www.fraserinstitute.org/studies/comparing-business-investment-per-worker-canada-and-united-states-2007-2024.
[3] "ASCE-EWRI Government Relations Update," American Society of Civil Engineers, May 1, 2025, https://www.asce.org/communities/institutes-and-technical-groups/environmental-and-water-resources-institute/news/asce-ewri-government-relations-update.
[4] Beth Kindig, "AI Capex to Hit $1 Trillion—and Estimates Are Still Too Low," I/O Fund, August 5, 2026, https://io-fund.com/ai-stocks/ai-capex-1-trillion-estimates-too-low.
[5] Jordan Chalfin and Michael Pugh, "Tech: Raising Hyperscaler Capex 2026 Estimates," CreditSights, February 9, 2026, https://www.fitchsolutions.com/creditsights/articles/technology/tech-raising-hyperscaler-capex-2026-estimates-09-02-2026.
[6] "Hyperscalers Tap External Financing as AI Capex Outruns Cash Flow," FactSet Insight, July 23, 2026, https://insight.factset.com/hyperscalers-tap-external-financing-as-ai-capex-outruns-cash-flow.
[7] Jason Lehmann, Dan Lowrey, and Heike Doerr, "Surging Energy Demand Puts US Utility Capex Forecast near $1.3T in 2026–30," S&P Global Market Intelligence, April 23, 2026, https://www.spglobal.com/market-intelligence/en/news-insights/research/2026/04/surging-energy-demand-puts-us-utility-capex-forecast-near-1-3t-in-2026-30.
[8] Piercen Hoekstra, "Record Utility Spending Meets Project Reality," ADI Analytics, July 2, 2026, https://adi-analytics.com/2026/07/02/record-utility-spending-meets-project-reality/.
[9] David Stanway, "AI to Double Data Centre Power and Water Consumption by 2030, UN Researchers Say," Reuters, June 3, 2026, https://www.reuters.com/business/energy/ai-double-data-centre-power-water-consumption-by-2030-un-researchers-say-2026-06-03/.
[10] Felicia Aminoff, "Electric Vehicles Remain Key Driver for Grid Investment Despite Data Center Boom," BloombergNEF, September 2, 2025, https://about.bnef.com/insights/clean-energy/electric-vehicles-remain-key-driver-for-grid-investment-despite-data-center-boom/.
[11] U.S. Census Bureau, "Total Construction Spending: Manufacturing in the United States [TLMFGCONS]," retrieved from FRED, Federal Reserve Bank of St. Louis, accessed November 18, 2026, https://fred.stlouisfed.org/series/TLMFGCONS.