Contexte boursier — un mois d’avril volatil
Avril 2026 a été un mois charnière au cours duquel les marchés boursiers états-uniens sont restés extrêmement volatils en raison à la fois des risques géopolitiques et du flottement entourant les décisions de la Réserve fédérale.La guerre au Moyen-Orient a continué de perturber le marché du pétrole, dont la volatilité a atteint des sommets, et le prix du brut Brent a dépassé les 110 $ le baril au cours du mois. Le choc énergétique a fait craindre la persistance de l’inflation et alimenté l’incertitude ayant trait à l’attitude à venir de la Fed. La situation a atteint son point culminant lorsque le FOMC a voté à 8 contre 4 pour garder les taux à l’intérieur d’une fourchette de 3,5 % à 3,75 %. À la lecture du communiqué, on apprend que trois membres se sont opposés au maintien d’une politique accommodante, une décision partagée qui indique le peu d’enthousiasme suscité par une réduction de taux à brève échéance.
Au cours des dernières semaines, plusieurs entreprises ont fait part de leurs résultats financiers pour le premier trimestre de 2026 et, une fois de plus, les centres de données à grande échelle ont revu à la hausse les investissements en capital. Meta et Alphabet ont toutes deux considérablement augmenté leur budget annuel de dépenses en capital, signe que les investissements colossaux dans l’IA et ses infrastructures — centres de données, serveurs et puces, entre autres — vont de l’avant. Amazon a, plus que toute autre compagnie, rehaussé la capacité de ses serveurs en 2025 et s’est engagée à accélérer ses efforts de construction en 2026. Microsoft prévoit que ses dépenses en capital trimestrielles destinées à améliorer ses capacités électroniques dépasseront les 40 milliards $.
Il en faudra sans doute davantage pour rassurer le marché sur le rendement de ces investissements, mais il n’en demeure pas moins que le premier trimestre de 2026 laisse envisager une accélération. Selon Bloomberg, les bénéfices des entreprises du S&P 500 ayant à ce jour publié leurs résultats (70 % selon la capitalisation boursière, soit 317 compagnies) ont monté de 25,8 % d’une année sur l’autre, c’est-à-dire plus du double des prévisions d’avant-saison et le taux le plus élevé depuis le T4 de 2021. Si on exclut les sept magnifiques, la croissance recule à 15,4 %, soulignant ainsi la concentration du marché (les secteurs des communications et des technologies ayant annoncé une croissance de 53,6 % et de 46,4 % respectivement).
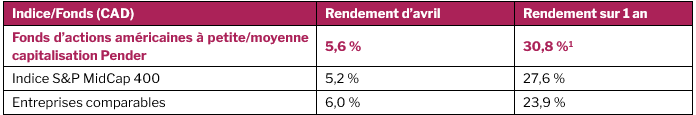
Source : Morningstar, au 30 avril 2026
Un sujet qui nous intéresse — les banques régionales
C’est dans ce contexte que nous avons suivi de près les banques régionales des États-Unis, un secteur qui a su résister à la volatilité généralisée et recèle de nombreuses possibilités. En avril, les résultats du premier trimestre sont entrés. Sur 44 banques, 35 ont surpassé de 6 % en moyenne les prévisions quant à leur BPA, malgré les pressions exercées sur le coût des dépôts et les marges d’intérêt nettes. Lors des conférences téléphoniques sur les résultats, les dirigeants ont vanté la résistance du consommateur états-unien, tant en matière de dépenses que d’utilisation du crédit. Ils ont aussi souligné que la qualité du crédit était stable et que les prévisions pour le reste de 2026 étaient encourageantes.
Au début de l’année, après deux ans de misère, les actions des banques de taille moyenne ont commencé à faire mieux que celles de leurs semblables de taille supérieure. L’indice KBW des banques régionales du Nasdaq, qui suit 50 banques ayant des actifs inférieurs à 100 milliards $ chacune, s’est relevé d’environ 10 % depuis le début de l’année, par rapport à 3 % pour l’indice KBW des banques du Nasdaq. Cela dit, les grandes banques continuent à se négocier à des primes appréciables : les banques du S&P 500 sont assorties d’une prime de 20 % sur leur valeur comptable par rapport à celles du S&P MidCap 400. Bien que l’écart soit redescendu de son sommet de plus de 30 %, il représente un retournement notable, les banques à capitalisation moyenne s’étant négociées à prime depuis les années 2010 jusqu’en 2024.
En ce qui a trait à l’avenir, nous croyons qu’il sera favorable aux banques régionales des États-Unis, conviction que renforce l’endurance démontrée par l’industrie pendant la saison financière du T1 2026. Malgré la volatilité macroéconomique, nous pensons que le reste de l’année pourrait être meilleur, avantagé par l’accentuation de la courbe des rendements, l’accélération de la croissance des prêts entraînée par les secteurs commerciaux et un possible revirement du climat réglementaire en faveur des banques. Même si les tensions géopolitiques continuent de nous préoccuper, le regard que nous portons sur le secteur reste positif.
Conséquences sur le portefeuille :
Nous avons liquidé notre participation dans Webster Financial Corp. (WBS) à la suite de l’annonce de son acquisition par Banco Santander à une prime de 16 %. Nous avons pris une position dans Western Alliance Bancorporation (WAL), l’une des banques les plus performantes du pays avec des actifs totalisant plus de 90 milliards $. Pendant la dernière décennie, WAL a été l’entreprise ayant connu la plus forte augmentation de sa valeur comptable tangible par action (excédant celle de ses pairs de 4,5 fois) avec un BPA livrant à ses actionnaires d’attrayants rendements totaux à long terme.
Installée à Phoenix, en Arizona, WAL a bâti sa réputation sur la résilience de ses services bancaires commerciaux, jumelant ses assises régionales à des segments spécialisés à forte croissance, le tout réuni sous l’appellation de Western Alliance Bank. Nous estimons que sa stratégie axée sur des créneaux verticaux lui confère un avantage structurel durable parce que les dépôts différenciés et fondés sur la relation client pourraient contribuer à abaisser les coûts des fonds qu’elle prête et à stimuler une forte croissance.
En avril, WAL a fait part de ses résultats trimestriels. La croissance de ses bénéfices avant taxes et provisions a atteint 42 % et celle de sa valeur comptable tangible par action 13 % d’une année sur l’autre pour se chiffrer à 61,14 $ la part. L’unique maillon faible est la radiation de prêts de 209 millions $, soit un montant 4,7 fois plus élevé que l’an passé, due à deux annulations de pertes liées à la fraude. Toutefois, la direction croit que le pire est passé et que le nombre de prêts non rentables devrait diminuer vers la fin du dernier semestre. Au cours du trimestre, les dépôts se sont élevés à 83 milliards $, une hausse séquentielle de 7,2 % (de plus de 19 % d’une année sur l’autre). L’entreprise a aussi racheté 50 millions $ de parts pendant le trimestre.
Mise à jour supplémentaire
Generac Holdings Inc. (GNRC), l’avoir le plus considérable du Fonds, a publié des résultats de T1 qui surpassent les prévisions des analystes tant globalement qu’en matière de recettes. La direction a également rehaussé ses projections annuelles selon lesquelles son revenu devrait croître de 15 à 20 % et les marges de son BAIIDA excéder de 50 pb les prévisions antérieures. Le point majeur du trimestre a été ce que la direction appelle une croissance « générationelle » sur le marché des centres de données qui a donné lieu à une majoration de 28 % dans le segment commercial et industriel. Generac continue de tirer profit de la demande soutenue des clients de centres de données et elle s’attend à obtenir sous peu une première commande substantielle de la part de très grands fournisseurs, contrat qui s’ajoutera au carnet de commandes de 700 millions $ de ses services de colocation. Ce mois-ci, Generac a contribué à hauteur de 137,6 pb à la performance du Fonds.
Aman Budhwar, CFA
13 mai 2026
1 Tous les rendements signalés sont ceux des parts de catégorie F du Fonds. D’autres catégories de parts sont offertes. Celles-ci pourraient présenter des frais et des rendements différents. Les données standards sur le rendement de ce fonds d’actions Pender sont présentées ici : https://penderfund.com/fr/fund/pender-us-small-mid-cap-equity-fund/.